Resource Center
All ContentBlogCase Studiesebooks
- Christy Maerz
- March 20, 2025
- 7 min read
Get crucial RCM metrics for better practice management
Discover how Insights Dashboards enable your practice to quickly and accurately measure performance. Read more
4 min read
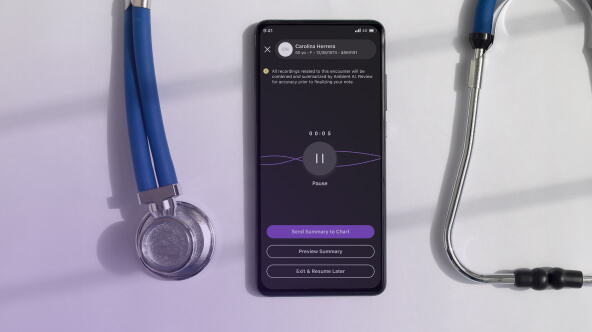
How Ambient Notes gave Dr. Smith her weekends back
Read how AI in healthcare has improved efficiency, accuracy, and patient care for Dr. Smith at Springfield Clinic.

7 min read
Top benefits and use cases of AI in healthcare
AI use for administrative tasks is on the rise. But how do physicians feel about this digital transformation?

7 min read
AI in healthcare: bridging the equity gap or widening it?
Healthcare AI is here—it’s at a crossroads. Read to learn how we can use this technology equitably.

6 min read
Cybersecurity and reliability: Is your EHR data protected?
Cyberattacks are common in healthcare. What protections should a trusted HIT provider deliver?

3 min read
Best practices to boost same-day chart closure rates
Reclaim your pajama time and drive EHR efficiency with best practices from the athenaOne® network.

7 min read
AI moving from hype to habit in physician workflows
AI adoption is growing among physicians but varies among use cases and practice sizes. Learn more from our experts.

5 min read
Top 6 challenges of insurance verification
Patient insurance verification is key to getting paid for the care you deliver. Watch for these common pitfalls.

4 min read
Advisory Services: Driving orthopedic practice efficiency
See how our Advisory Services team helped boost orthopedic practice performance at three organizations.

6 min read
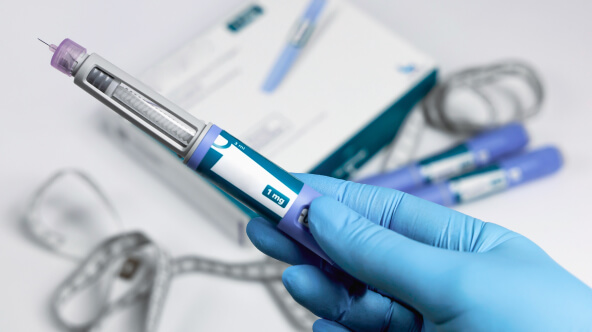
National GLP-1 trends reveal evolving prescribing patterns
Prescription rates of semaglutide meds like Ozempic are shifting. Learn more from athenahealth data.

6 min read
What physicians really want from their EHR
Get findings and expert insights to help your practice bridge the gaps with data exchange.

5 min read
How athenaOne® enables EHR & practice management efficiency
The right tasks. The right time. See how our practice management and EHR software saves effort.

6 min read
Chart closure rates: A gauge to measure clinical efficiency
Do you know your Same Day Encounter Close Rate? Get to know this yardstick for clinical efficiency.


